Ellsberg's Paradox
I was reading the book “How Not to Be Wrong: The Power of Mathematical Thinking” by Jordan Ellenberg. The book introduces a paradox named after Daniel Ellsberg, a young analyst at RAND Corporation and famous for leaking the Pentagon papers to civilians. Von Neumann and Morgenstern had proven that all individuals acted based on certain rules so as to maximize their utilities (The Theory of Games and Economic Behaviour, 1944). While working at RAND on humans taking decisions under the face of uncertainty, he devised a famous experiment, now known as Ellsbeg’s Paradox.
Suppose there is an urn (or a bag) with ninety balls inside. You know that that thirty of the balls are red; concerning the other sixty balls, you know only that some are black and some are yellow. The experimenter describes to you the following bets:
- Red: You get $100 if the next ball pulled from the urn is red, else you get nothing.
- Black: You get $100 if the next ball is black, otherwise nothing.
- Not-red: You get $100 if the next ball is either black or yellow, otherwise nothing.
- Not-black: You get $100 if the next ball is either red or yellow, otherwise nothing.
Which bet do you prefer; Red or Black? What about Not-red vs Not-black?
How Not to Be Wrong: The Power of Mathematical Thinking, Jordan Ellenberg
Simulation
I want to run a simulation study of this experiment. We know that some are black and some are yellow. I want to vary the number of black and yellow balls in the urn to check the most sensible bet at different combinations.
# total number of balls
n_total = 90

# red balls
n_red = 30

# possible number of red balls
np_black = c(1:(n_total - n_red))
np_yellow = n_total - n_red - np_black
Now, think about this — the number of red balls are fixed (30). The number of black and yellow balls can vary between one to 59, with their sum fixed at 60. Therefore, for each number of black (or yellow) ball, we have distinct probabilities for all four bets. Let us calculate them.
# creating vectors to store probabilities of black and yellow colours
# (probability of red will always remain 1/3)
p_black = np_black/n_total
p_yellow = np_yellow/n_total
Let us visualize these results.
plot(p_black, type = "l", lwd = 3, col = "black",
     xlab = "Number of Black Balls", ylab = "Probability of Bets");
abline(h = 1/3, lwd = 3, col = "red");
lines(p_yellow, type = "l", lwd = 3, col = "yellow")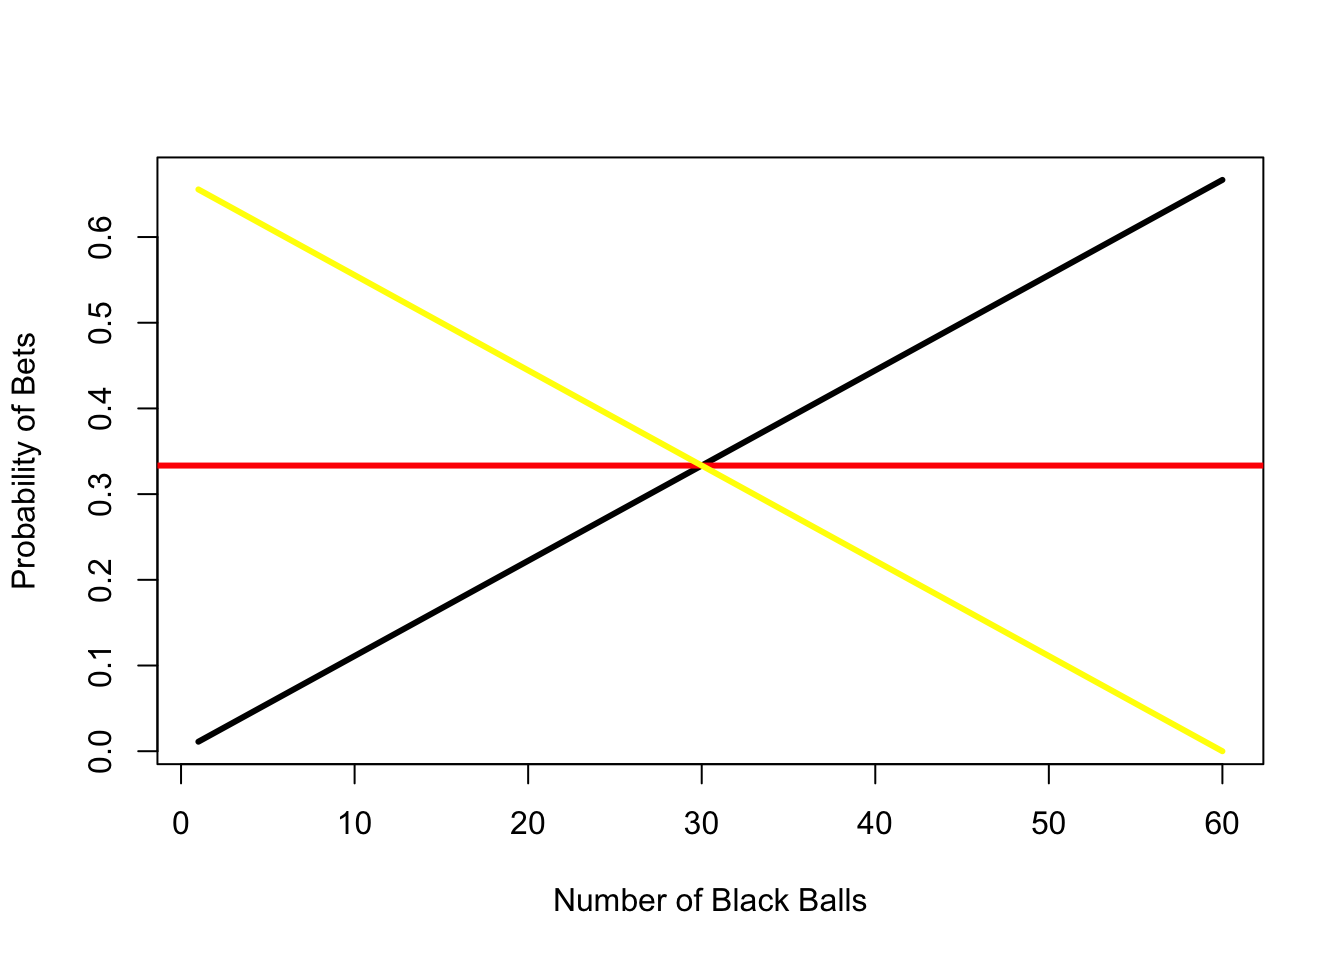
Depending on how many black balls are in the urn, you have different probabilities of winning — nothing unexpected. It is apparent that one should choose Yellow when the number of black balls is less than thirty and Black when the number of black balls is more than thirty. The only case when one could choose Red is when all the balls are in equal number in the urn, and they should be indifferent between all three at that point.
Catching Up
However, our original experiment wasn’t about choosing any of these individual colors, it was choosing between the four bets: Red, Not-red, Black and Not-black. Which of these is the better option? Let’s find out!
The probability of Red remains fixed at one-third, no matter what is the combination of black and yellow. Therefore, the probability of Not-red also remains fixed at two-third. The probability of Black varies between 1/60 to 59/60. Therefore, the probability of Not-black varies from 59/60 to 1/60. Let’s visualize all of these!
Bets Not-red and Not-black are represented by blue and gray respectively.
plot(p_black, type = "l", lwd = 3, col = "Black", xlab = "Number of Black Balls",
     ylab = "Probability of Bets", ylim = c(0,1));
lines(1-p_black, lwd = 3, col = "Gray");
abline(h = 1/3, lwd = 3, col = "Red");
abline(h = 2/3, lwd = 3, col = "Blue")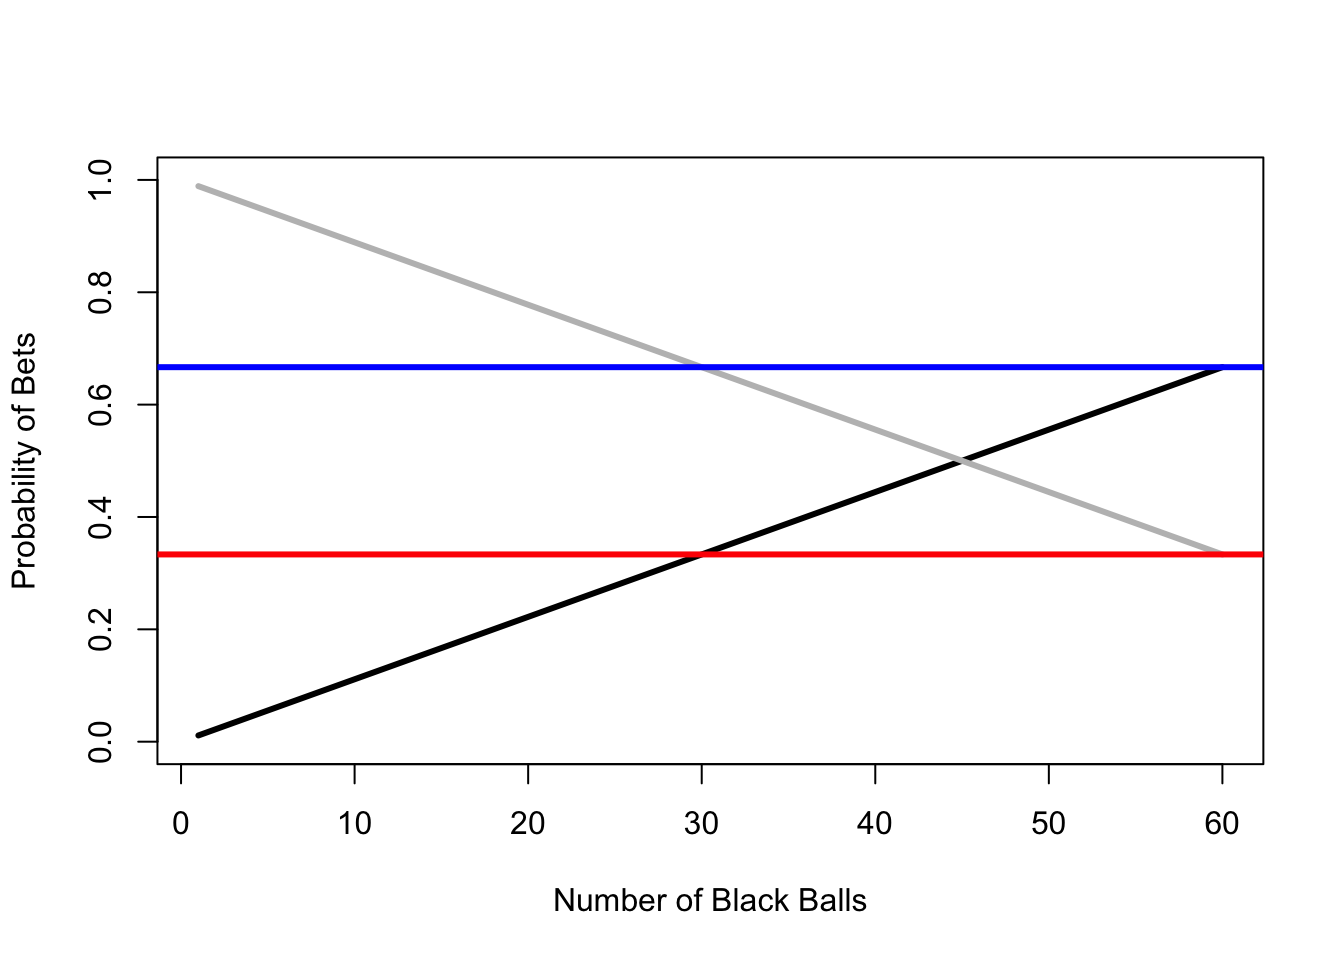
Clearly, Not-red dominates Red and Black. Not-black dominates Red. So, if presented a choice, I would bet on Not-black if the number of black balls is less than 30 and Not-red if the number of black balls is more than 30. Since the number of black balls in not known, I will compare the expected value — which is exactly the same for both cases. (A simple way to check this is compare the area under the curve for blue and gray lines. In this case, they’re both 40.)
The Paradox
However, Ellsberg found that almost everyone preferred the Not-red bet over Not-black even when game theory and statistics showed that the two choices should be equally-preferred. This phenomenon was termed “uncertainty aversion”.
When individuals are presented with choices that are equally profitable, they choose the one that has lower uncertainty. This uncertainty is different from risk, which is usually measured as standard deviation in statistics. Risks are known unknowns and uncertainties are unknown unknowns (Donald Rumsfeld). When presented with the latter, we always choose the option that has lower uncertainty.
This experiment and paradox may sound trivial today but when it was first presented to the world it was a breakthrough. Utility maximization theory by Von Neumann and Morgenstern was seriously challenged by the results. Utility theory, hitherto unchallenged, had met its first limitation. Today, these limitations are well accepted among economists.